Urban heat
Contact
Introduction
The urban heat island effect occurs when temperatures increase in urban areas relative to surrounding natural or rural environments. These higher urban temperatures can be caused by factors such as reduced shading, abundance of materials that absorb heat, reduced evapotranspiration and waste heat from infrastructure and vehicles.
This phenomenon can negatively affect people and infrastructure, particularly during prolonged heat waves.
CRCWSC research on the urban heat island effect demonstrates the climatic benefits of water sensitive cities.
Research findings and reports
Our research on urban heat has identified some interesting findings, for example:
- A report on extreme heat events identified threshold temperatures for Australian capital cities above which mortality and morbidity increase. For example, temperatures above 41oC in Adelaide were associated with a 2–8 per cent increase in mortality. It also maps population vulnerability to extreme heat events in large urban areas. (Spatial vulnerability analysis of urban populations during extreme heat events in Australian capital cities)
- During a heat wave in Adelaide, the air temperature above an irrigated surface was up to 2.3°C cooler than the air temperature above an unirrigated surface. Air temperature reductions were found to be a function of the irrigation rate and timing. (The cooling effect of irrigation on urban microclimate during heatwave conditions)
- The influence of trees on streetscape air temperature and Human Thermal Comfort is a function of canopy extent, street geometry, and prevailing meteorological conditions. The cooling benefit of street tree canopies increases as street canyon geometry shallows and broadens. (Temperatures and human thermal comfort effects of street trees across three contrasting street canyon environments)
- On very hot days in 2014, the air temperature below the canopy of a single isolated tree in Melbourne was 0.6–1.2oC cooler than immediately upwind of the tree. Comparing the air temperature in two residential streets in East Melbourne during hot daytime conditions, the air temperature in a tree lined street was 0.2–0.9oC cooler than in an equivalent street with little canopy cover. (Determine the microclimatic influence of harvesting solutions and WSUD at micro-scale)
- The urban heat island effect is a function of time of day and the day of the week. This means that during heat waves, urban heat can be reduced by changing human activities to those of a weekend day. (Weekly cycles in peak time temperatures and urban heat island intensity)
You will find a range of research reports on urban heat under the categories below.
Impacts of water on urban heat
- Determine the microclimate influence of harvesting solutions and WSUD at the micro-scale
- The cooling effect of irrigation on urban microclimate during heatwave conditions
- Green Cities and Micro‐climate – Interim Report
- Watering our cities: the capacity for water sensitive urban design to support urban cooling and improve human thermal comfort in the Australian context
- New urban storm water management approaches: using the water generated by cities for ecosystem services
- Determine the microclimatic influence of harvesting solutions and WSUD at the micro-scale. Presented as: FREQUENTLY ASKED QUESTIONS
- Impacts of WSUD solutions on human thermal comfort
- The impacts of harvesting solutions and WSUD on evaporation and the water balance and feedbacks to urban hydrology and stream ecology
Impacts of green infrastructure on urban heat
- Planning for cooler cities: A framework to prioritise green infrastructure to mitigate high temperatures in urban landscapes
- The influence of increasing tree cover on mean radiant temperature across a mixed development suburb in Adelaide, Australia
- Health and climate related ecosystem services provided by street trees in the urban environment
- Temperature and human thermal comfort effects of street trees across three contrasting street canyon environments
Modelling urban heat
- Simulating the surface energy balance over two contrasting urban environments using the Community Land Model Urban
- Development of the VTUF-3D v1.0 urban micro-climate model to support assessment of urban vegetation influences on human thermal comfort
- VTUF-3D: An urban micro-climate model to assess temperature moderation from increased vegetation and water in urban canyons
- Can a spatial index of heat-related vulnerability predict emergency service demand in Australian capital cities?
- The implementation of biofiltration systems, rainwater tanks and urban irrigation in a single-layer urban canopy model
- Thermal infrared remote sensing of urban heat: Hotspots, vegetation, and an assessment of techniques for use in urban planning
Measuring urban heat
- Is the urban heat island exacerbated during heatwaves in southern Australian cities?
- Weekly cycles in peak time temperatures and urban heat island intensity
- The Sensitivity of Urban Meteorology to Soil Moisture Boundary Conditions: A Case Study in Melbourne, Australia
- Mapping heat health risks in urban areas
- Remotely sensed thermal pollution and its relationship with energy consumption and industry in a rapidly urbanizing Chinese city
- An exploration of temperature metrics for further developing the heat-health weather warning system in Hong Kong
Impacts of urban heat on humans
- Short-term changes in thermal perception associated with heatwave conditions in Melbourne, Australia
- Perceptions of thermal comfort in heatwave and non-heatwave conditions in Melbourne, Australia
- The impact of “unseasonably” warm spring temperatures on acute myocardial infarction hospital admissions in Melbourne, Australia: A city with a temperate climate
- Identifying vulnerable populations in subtropical Brisbane, Australia: A guide for heatwave preparedness and health promotion
- Heat stress during the Black Saturday event in Melbourne, Australia
- Visitors’ perception of thermal comfort during extreme heat events at the Royal Botanic Garden Melbourne
Population heat vulnerability
- Urban populations’ vulnerability to climate extremes: mitigating urban heat through technology and water-sensitive urban design
- Climate Change Adaptation for Health and Social Services
- A spatial vulnerability analysis of urban populations during extreme heat events in Australian capital cities
- Learning from our older people: Pilot study findings on responding to heat
Other
Research application
The CRCWSC’s urban heat research has been applied to projects in a range of settings:
- It was used to assess how various development options could impact urban heat and the water cycle in a hypothetical development at the Highett Gasworks.
- It informed the Adelaide Airport Irrigation Trial, which demonstrated that irrigation can lower the air temperature by more than 3° C on hot days, compared with unirrigated areas.
- We have used our flagship research synthesis platform to identify regional opportunities for reducing urban heat (e.g. Ideas for the Liverpool Collaboration Area, Ideas for Ocean Reef Marina, Ideas for a Water Sensitive Sydenham to Bankstown Urban Renewal Corridor).
- The Dubbo Urban Heat Amelioration Project used the Scenario Tool (see below) to quantify and help visualise the impacts improving street tree coverage in one of Dubbo’s busiest streets (Bultje Street)
- We estimated the biophysical impacts and economic value produced by urban heat mitigation in a greenfield residential development in Melbourne’s west of Melbourne. Urban greening and integrated water management could cool summer temperatures by up to 2° C, producing economic benefits per household of between $500 to $1,500 (summary).
- This report explains urban heat science, drawing on research by the CRCWSC and other scientific literature. It provides a base for evidence-based urban heat policy. (Managing urban heat in water sensitive cities: research and policy responses)
Tools and guidelines
We have developed industry tools and guidelines informed by our urban heat research, for example:
- Practitioners can use modules within the Scenario Tool to rapidly assess the impact of urban development scenarios on urban heat.
- Practitioners can use our INFFEWS tools (Benefit Cost Analysis Tool and Value Tool) to monetise non market costs and benefits relating to urban heat.
- Trees for a Cool Green City: Guidelines for optimised tree placement guides practitioners on where to place street trees to maximise the cooling effects, depending on street design and orientation.
- Designing for a cool city: Guidelines for passively irrigated landscapes guides practitioners on how to use stormwater to irrigate street trees, gardens and turf, and maximise their cooling benefits.
- Practitioners can use this framework to prioritise and select urban green infrastructure (e.g. street trees, parts, green roofs and facades) for cooling. (Planning for cooler cities: a framework to prioritise green infrastructure to mitigate high temperatures in urban landscapes)
Infographics
The following infographics can be useful for demonstrating urban heat concepts:
Infographic 1
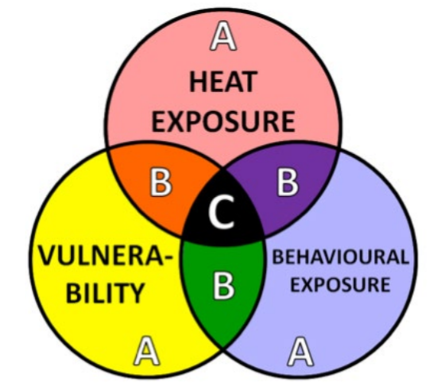
Factors used to identify high (C), medium (B) and moderate (A) tree priority areas (Norton et al., 2015. 'Planning for cooler cities: A framework to prioritise green infrastructure to mitigate high temperatures in urban landscapes'. Landscape and Urban Planning, 134, pp. 127-138.)
Infographic 2
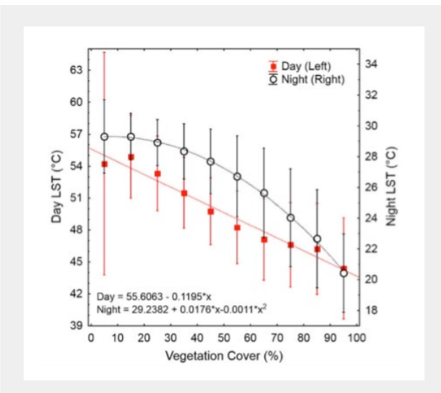
Relationship between vegetation cover and land surface temperature during a hot day and night in the City of Port Phillip in Melbourne (Coutts et al., 2016. 'Thermal infrared remote sensing of urban heat: Hotspots, vegetation and an assessment of techniques for use in urban planning'. Remote Sensing of Environment, 186, pp. 637-351.)
Infographic 3
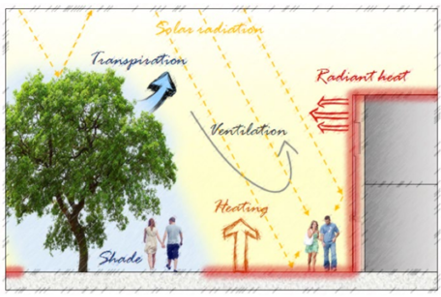
Key environmental components influencing human thermal comfort during the day (Coutts A and Tapper N, 2017. Trees for a cool city: Guidelines for optimised tree placement. Melbourne: CRC for Water Sensitive Cities.)
Infographic 4
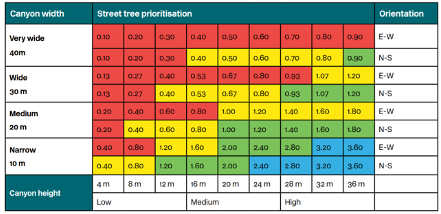
Priority rating for trees for reducing daytime Human Thermal Comfort in streets in Melbourne based on canyon width (i.e. distance between buildings) and canyon height (i.e. building height). Red = highest priority; Blue = lowest priority (Norton et al., 2015. 'Planning for cooler cities: A framework to prioritise green infrastructure to mitigate high temperatures in urban landscapes'. Landscape and Urban Planning, 134, pp. 127-138.)
Infographic 5
Relationship between surface type and Land Surface Temperature on an extreme heat day (CRC for Water Sensitive Cities, 2020. Designing for a cool city: Guidelines for passively irrigated landscapes. Melbourne: CRC for Water Sensitive Cities, p. 12.)
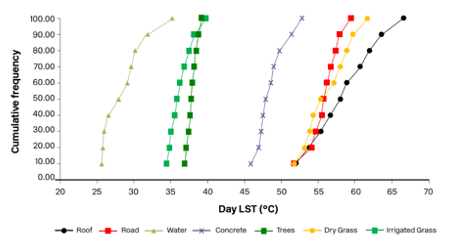
Infographic 6
Benefits of passively irrigated systems: large trees (CRC for Water Sensitive Cities, 2020. Designing for a cool city: Guidelines for passively irrigated landscapes. Melbourne: CRC for Water Sensitive Cities, p. 16.)

Infographic 7
Benefits of passively irrigated systems: increased urban greening (CRC for Water Sensitive Cities, 2020. Designing for a cool city: Guidelines for passively irrigated landscapes. Melbourne: CRC for Water Sensitive Cities, p. 16.)

Infographic 8
Benefits of passively irrigated systems: street trees (CRC for Water Sensitive Cities, 2020. Designing for a cool city: Guidelines for passively irrigated landscapes. Melbourne: CRC for Water Sensitive Cities, p. 16.)

Infographic 9
Benefits of passively irrigated systems: increased green spaces (CRC for Water Sensitive Cities, 2020. Designing for a cool city: Guidelines for passively irrigated landscapes. Melbourne: CRC for Water Sensitive Cities, p. 16.)

Infographic 10
Spatial variability of the Melbourne urban heat island at 0100, 23 March 2006 (Coutts et al., 2016. 'Thermal infrared remote sensing of urban heat: Hotspots, vegetation and an assessment of techniques for use in urban planning'. Remote Sensing of Environment, 186, pp. 637-351.)

Infographic 11
Recommended temperature thresholds based on city-specific mortality measures (Loughnan et al., 2013. A spatial vulnerability analysis of urban populations during extreme heat events in Australian capital cities. Gold Coast: National Climate Change Adaptation Research Facility, p. 39.)

Infographic 12
Recommended temperature thresholds based on city-specific morbidity measures (Loughnan et al., 2013. A spatial vulnerability analysis of urban populations during extreme heat events in Australian capital cities. Gold Coast: National Climate Change Adaptation Research Facility, p. 39.)

Infographic 13
Approaches to reducing urban heat (Coutts et al., 2016. 'Thermal infrared remote sensing of urban heat: Hotspots, vegetation and an assessment of techniques for use in urban planning'. Remote Sensing of Environment, 186, pp. 637-351.)
